Lottery Fairness Score: Is Your Lottery Rigged? (2025)
(Editor’s note: We have revised some of the statistically inaccurate claims made in previous versions of the post thanks to the invaluable insights of the reddit community in r/AskStatistics. We are committed to transparency and will continuously refine our analysis based on new draw data and valuable feedback from the data science and statistics communities. Our goal is to provide the most robust and accurate audit possible).
Ever wonder if your favorite lottery is rigged or truly random? It’s a common question, especially when jackpots climb into the hundreds of millions. At Lucky Picks, we believe that players deserve transparency, so we developed the Fairness Score. It’s a first-of-its-kind statistical audit for lotteries.
Our goal isn’t to predict winning numbers – that’s impossible. Instead, we aim to provide interesting and deep statistical insights about the game, and a fun experience generating numbers based on these insights.
The Fairness Score is designed to give users a clear, data-driven look at the integrity of the game itself, so they can play with confidence. It’s a screening system that scans for any statistical irregularities that lottery players should be aware of.
What exactly is the Fairness Score?
The Fairness Score is a transparency metric that applies standard statistical tests to historical lottery draws. It produces a simple 0 – 100 score indicating how closely the draw outcomes align with the expectations of a truly random process.
- A score near 100 means the lottery is behaving with a high degree of randomness, consistent with a fair game.
- A score below 70 indicates that our analysis has detected a statistically significant bias or pattern that is worth closer scrutiny.
There are important statistical considerations and concept at play here, and at the heart of it, the difference between exploratory analysis and confirmatory analysis.
Exploratory Analysis (What the Fairness score does): This is like a detective scanning a wide area for any clues. We run many tests across different windows, days, and patterns to see if anything interesting pops up. This is a valid and powerful way to generate hypotheses.
Confirmatory Analysis: This is what happens after one finds a clue. It involves a single, rigorous test of a pre-defined hypothesis. This is NOT what the Fairness Score is about.
Said differently, our Fairness Score hypothesis is not asking: “Is there proven bias in exactly this specific pattern I predicted would be beforehand?”. Instead, It’s asking: “Should users be aware of any statistical irregularities in this lottery’s behavior?”.
How We Calculate the Score: The Three Pillars of Fairness
The overall Fairness Score is a weighted average of three distinct analytical pillars, each designed to test a different aspect of randomness.

1. Number Bias This is the most fundamental test pillar. It answers the question: “Is every number being drawn an equal number of times over the long run?” We use a Chi-Square Goodness-of-Fit test to compare the actual frequency of each number drawn against the frequency we would expect to see in a perfectly random system. We also run other proprietary enhancements to this test, including recent “sliding windows” of data (like the last 100 draws) to detect any new or emerging trends.
2. Draw Day Bias This test pillar looks for temporal anomalies. It answers questions like: “Are there potential statistical bias in draws on a Mondays? on a Saturday? on the 14th of each month” By grouping draws by the day of the week or the day of the month, we can detect if a specific day has a statistically unusual pattern of results, which could point to operational inconsistencies.
3. Pattern Bias This is our most advanced analysis. It looks beyond individual numbers to analyze the structure of the winning combinations themselves. We run a series of Chi-Square tests to see if patterns – like the split of Odd vs. Even numbers, or High vs. Low numbers – are appearing at a rate consistent with their theoretical odds. A significant deviation here can uncover subtle but persistent biases in the draw results.
The Fairness Score in Action: A Three-Lottery Comparison
To see how these pillars work in the real world, let’s look at the current Fairness Scores for three major lotteries.
- Powerball: A Perfect Score (100/100) Our analysis of over 1,200 Powerball draws shows a high degree of randomness across the board. The Number Bias, Draw Day Bias, and Pattern Bias tests all confirm that the game is behaving as a fair and random system should. This is the benchmark for a statistically sound lottery.
- Mega Millions: A Persistent Pattern Bias (87/100) Mega Millions has a perfect score for its number and draw day randomness. However, the score is impacted by a persistent Pattern Bias. Our analysis shows a significant deviation in the High/Low number distribution, where combinations with all low numbers have appeared more often than statistical odds would predict over the long term.
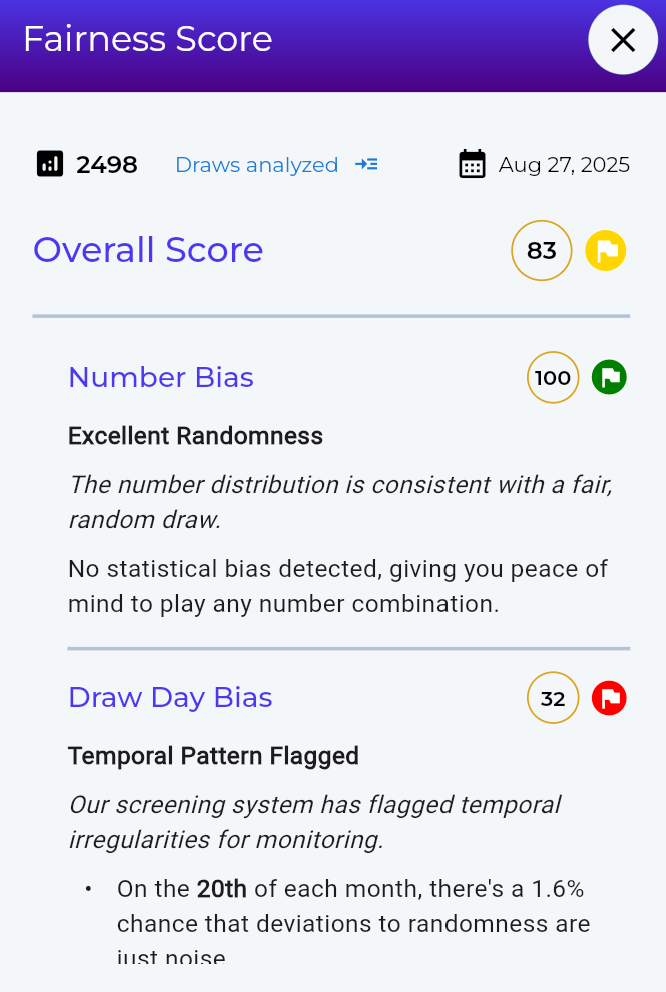
- New York Lotto: A Temporal Anomaly (83/100) The New York Lotto also shows excellent randomness in its number and pattern distributions. However, our engine flagged a significant Draw Day Bias. The analysis revealed that draws held on the 20th of each month have a statistically unusual pattern of results, with certain numbers appearing far more or less often than they should on that specific day.
“No-Nonsense” Insight: What a Score Means for You
The Fairness Score isn’t just a number; it’s an actionable insight.
- A high score, like Powerball’s 100, gives you strategic peace of mind. It confirms that the game is a level playing field where no specific numbers or patterns have an unfair advantage.
- A lower score, like those for Mega Millions or the New York Lotto, provides a unique analytical insight and a potential strategic edge. It’s important to be clear though: this is not an assertion of bias, nor is it a game changer as the astronomical odds of winning are still going to apply. Users should treat it as a piece of data that can inform their choices. It’s a data-driven information about a statistical bias, allowing you to either play into the observed trend or play against it.
“No-Nonsense” Insight: From Statistical Bias to a ‘Smoking Gun’
The Fairness Score is designed to detect statistical anomalies, but what does it take to move from an interesting “quirk” to a genuine “smoking gun” for potential rigging?
A single low score in one category should be treated as a statistical curiosity, not proof of fraud. It’s a detective, not a judge.
Real evidence of rigging would require a convergence of multiple, strong indicators, with even more rigorous and single tests that accounts for corrections. Broadly speaking, we can look for a “smoking gun” based on the following criteria:
- Cross-Category Failure: A low score in one area (like Patterns) is an anomaly. Low scores across all three pillars – Number, Draw Day, and Pattern Bias – would suggest a systemic, non-random influence is affecting every aspect of the draw.
- Astronomically Low P-Values: A p-value of 0.02 is significant and noteworthy, and it’s our threshold for reporting, but it’s not yet a completely iron clad proof of fraud (it could be mechanical failure, or other factors). However, a p-value of 0.0001 would be a massive red flag that suggests nefarious intent.
- A Sudden “Change Point”: The most powerful signal would be a sudden, unexplained drop in a lottery’s Fairness Score. A lottery that is stable at 98/100 for years and then suddenly plummets to 40/100 and stays there would be a major indicator that a new, non-random process was intentionally introduced.
On State-Specific Rigging
A common concern is that multi-state lotteries are rigged to favor certain states. A high Fairness Score is actually strong evidence against this. A truly random number draw has no knowledge of where tickets are sold. The winning numbers are selected first, and only then is a winner found. The only way for a state to have more winners is to sell more tickets. If our analysis confirms the number generation process is random, it means the system is not being manipulated to favor a pre-selected ticket from a specific location.
Ultimately, the Fairness Score is about empowering you, the player, with real data. It pulls back the curtain on the statistical behavior of the lottery, allowing you to move beyond suspicions and make your choices with the confidence of an informed analyst.
One response to “Is The Lottery Rigged or Truly Random? Defining a Fairness Score”
Hoping it brings me luck.