Case Study: Monitoring a Real Hot-Number Anomaly in Mega Millions
Published April 2, 2026
If we had published this on April 1, a lot of people would have assumed it was a joke. It wasn’t.
Over the past month, our live monitoring systems detected that strategies built around recently hot numbers were outperforming a Monte Carlo random baseline by about 17% in win ratio.
At the same time, our fairness monitoring system flagged a drop in Mega Millions’ overall Fairness Score from 99 to 88 because of an unusual degree of temporal clustering in the recent draws.
That does not mean Mega Millions is rigged. It also does not mean hot numbers suddenly became predictive. But it does make for a useful case study in what live lottery monitoring is supposed to do: detect unusual conditions in real time, surface them clearly, and help users respond inside the product without pretending the underlying game has stopped being random.
The Trigger: Two Independent Monitoring Systems Flag the Same Pattern
At Lucky Picks, we do not just archive past results. We continuously monitor the behavior of lotteries through multiple systems designed to detect unusual short-term conditions.
In this case, two separate systems flagged the same recent Mega Millions pattern.

1) Fairness Score Decline
Our first layer of monitoring is structural. It uses statistical tests, including chi-square goodness-of-fit methods across multiple overlapping windows, to ask whether recent draw behavior still looks consistent with a stable random process.
Mega Millions usually carries a very high Fairness Score. Recently, that score dropped from 99 to 88 because the temporal component of the system detected an unusual degree of clustering in the recent data. Put simply, the numbers were not spreading out as evenly as we would typically expect over that short window.
2) Strategy Monitor Lift
Our second system approaches the same draw history differently. Instead of testing distribution shape directly, it simulates strategy performance against a Monte Carlo random baseline using rolling windows.
At the same time the Fairness Score weakened, this system also detected recent hot-strategy outperformance. Over roughly the last month of Mega Millions draws, hot-number strategies showed about a 17% lift in win ratio relative to random-play simulations.
That does not turn hot numbers into a cheat code. But when two independent monitoring systems flag the same recent pattern, it becomes much harder to dismiss the result as a quirk of a single lens.
One system measures whether recent draw behavior still looks visually and statistically balanced. The other checks whether a named strategy lens is suddenly outperforming its random baseline. They are not the same algorithm, which is why convergence matters here.
What the Math Is Actually Showing
This is the part that matters most.
A 17% lift over a one-month window sounds dramatic. But Mega Millions only draws a couple of times per week, which means this window is still small in absolute terms. In a sample that short, random variation can create clusters, streaks, and temporary imbalances that look striking in the moment.
That is the most likely explanation here: short-term variance.
In other words, this is not evidence that the game is broken. It is evidence that fair random systems can still look lopsided for a while, and that those lopsided stretches can be detected while they are happening.
This post does not argue that Mega Millions has stopped being random. It shows that a live monitoring system can surface a temporary cluster strongly enough that multiple independent signals point in the same direction at once.
That distinction is central to the Lucky Picks model. We are not selling certainty. We are documenting when the short-term picture becomes unusual enough to deserve attention.
Why This Matters
This is exactly the kind of event Lucky Picks is built to surface.
The point of live monitoring is not to promise guaranteed wins or pretend we can beat the lottery. The point is to identify what is happening in the data right now, so users can decide what they want to track, compare, save, or follow more closely.
That is what makes this case study useful. For a period of time, Mega Millions has not been behaving in the most visually balanced way. Recent hot-number clusters have been strong enough to affect both our Fairness Score and our rolling strategy monitor. Even if that condition is temporary, it is still meaningful inside the product because it changes what is most relevant to watch.
If you want the full research context behind the fairness framework, see our Mega Millions Fairness Audit and the broader Fairness Score methodology. If you want to understand the hot-number lens itself, the Hot vs. Cold Numbers explainer breaks down what is descriptive versus what is predictive.
How to Navigate the Data Without Doing the Math
A live pattern does not have to be predictive to be actionable inside the app. But acting on data should not require a spreadsheet or a manual standard-deviation check.

If you want to explore the current Mega Millions anomaly, Lucky Picks translates the math directly into the interface.
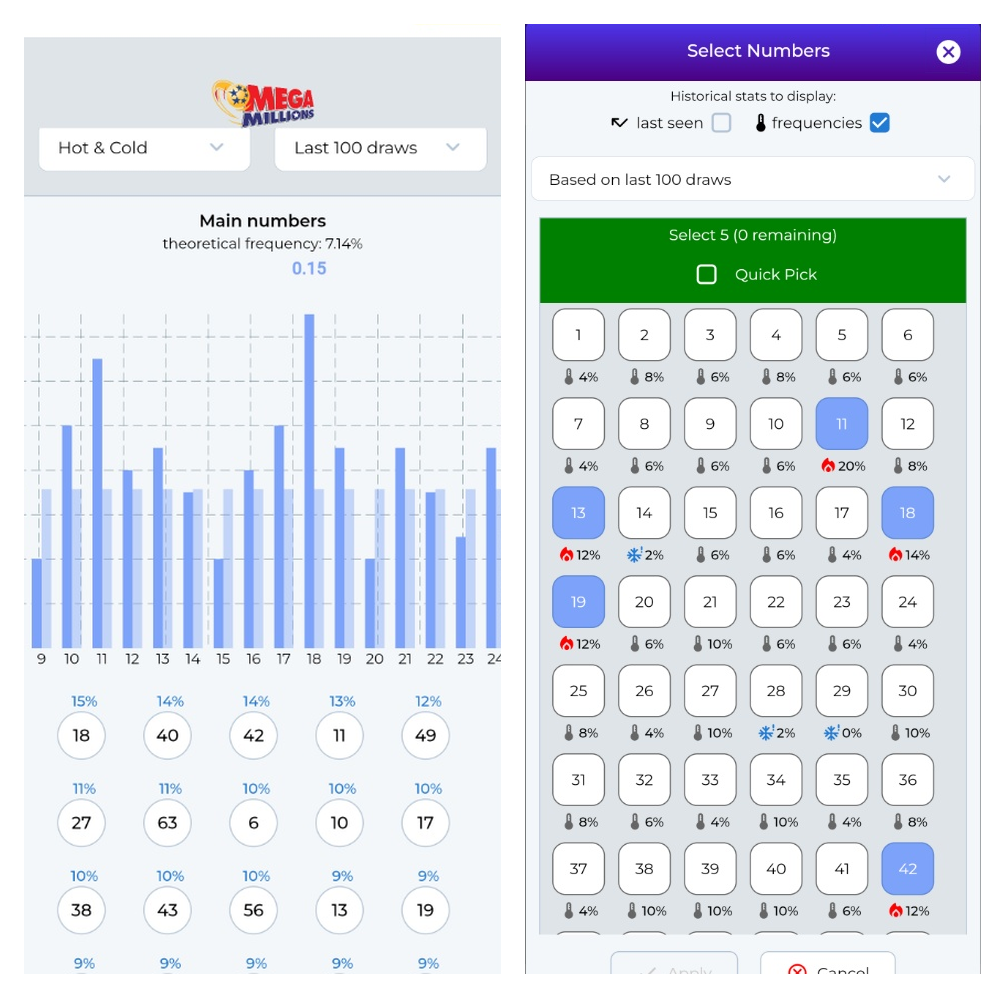
When you go to generate your numbers, you can toggle the historical stats directly onto the selection grid. Instead of guessing, the app overlays hot numbers with fire icons and exact historical frequencies, making it easier to see which numbers are driving the recent cluster.
- Build it yourself: Manually select combinations based on the active heat map and recent frequency overlays.
- Let the app generate: Use Quick Pick while the Hot strategy filter is active to generate sets aligned with the current cluster without pretending the future is known.
- Compare and save: Save your sets so you can monitor whether the pattern persists or fades over the next few draws.
The product goal is clarity, not theater. We do the heavy lifting so users can explore a live condition intelligently without being told that the math has somehow conquered randomness.
A number can be hot because it has appeared more frequently in the recent window. That is a historical description. It does not mean the number is now more likely to appear in the next draw.
The Likely Ending
Patterns like this usually do not last forever.
If this is what it most likely is, a short-term clustering event inside a fair random process, then the data should eventually smooth out, the recent lift should weaken, and Mega Millions’ Fairness Score should recover.
That is not a failure of the system. That is exactly how a good live monitor is supposed to behave: surface unusual conditions when they emerge, then show them fading when they revert.
Final Takeaway
Mega Millions is still a random game. Nothing in this case study changes that.
But randomness is not always visually smooth in the short term. Sometimes it clusters. Sometimes those clusters become large enough to matter across multiple monitoring systems at once. That is what happened here.
And that is why live monitoring is useful: not because it turns randomness into certainty, but because it helps users see unusual conditions clearly enough to engage with them intelligently.
Want to explore the current Mega Millions pattern for yourself? Open Lucky Picks to review the latest hot-number trends, compare strategies, and save the sets you want to keep watching.
Explore the Mega Millions signal inside Lucky Picks
Review live hot-number trends, compare strategy lenses, inspect fairness context, and save the sets you want to keep watching. The goal is better visibility into the data, not false promises about the next draw.